Add-ons
The ROOK Connect platform offers multiple add-ons to customize the data integration architecture. Core capabilities such as Time Zone alignment and Data Cleaning are activated by default, while optional ones such as Granular Data extraction, Notification Webhooks, hourly Steps Events, Lab Data, Clinical Ready, Medical Device Metadata, and User Health Profile require manual activation. Pre-Existing Data automatically retrieves up to seven days of historical records for API-based sources on the initial user connection, enabling immediate health metric analysis.
ROOK offers several add-ons that extend the integration experience. Some add-ons are activated by default, while others must be requested. To activate an optional add-on, contact the ROOK support team or your account manager.
| Add-on | What it adds | Activated by default |
|---|---|---|
| Time Zone | Ensures local time delivery | Yes |
| Data Cleaning | Improves data accuracy | Yes |
| Activate Granular Data | Optimizes data delivery | No |
| Notification Webhook | Real-time integration notifications | No |
| Callback URL Setup | Redirects users post-connection | No |
Connections Page Sandbox | Simplifies user authorization | Yes |
| Pre-Existing Data | Historical data retrieval | Yes |
| Steps Events in API | Hourly step polling | No |
| Lab Data | Laboratory document processing | No |
Clinical Ready Beta | FHIR R4 clinical documents | No |
| Medical Device Metadata | Device and regulatory metadata | No |
| User Health Profile | Generated profile with health scores | No |
Health Monitoring Beta | Baseline and threshold alerts | No |
Branded Auth On Hold | A fully personalized experience | No |
Time Zone
The Time Zone add-on ensures that daily summary data is extracted and delivered based on each country’s local time zone.
This add-on is activated by default in ROOK Connect. Additional details are available in the Data Extraction section.
To set up the time zone of your users, check the following endpoint.
Data Cleaning
The Data Cleaning add-on prioritizes and cleans health data from multiple sources for the same user, ensuring the delivery of accurate and comprehensive data structures. This add-on is activated by default in ROOK Connect. For more details, visit the Data Processing section.
Activate Granular Data
The Activate Granular Data add-on enables access to detailed health metrics such as heart rate, heart rate variability, blood pressure, and additional minute-level readings. This option increases payload depth and provides a richer dataset for clients who need more precise insights.
The add-on is not activated by default. More information is available in the Granular Data section.
To activate Granular Data, contact the ROOK support team or your account manager.
Notification Webhook
The Notification Webhook add-on provides real-time updates about integration-specific actions, including user creation, data source connections, and failed notifications. This webhook does not deliver health data, but it provides essential updates for monitoring and troubleshooting.
User management notifications
Notifications are triggered by actions such as:
- New user creation
- Data source connections or disconnections
- Failed data extractions
Example notification for a user connection
{
  "client_uuid": "123456789",
  "user_id": "UserTest12345",
  "data_source": "garmin",
  "action": "user_connected",
  "level": "info",
  "message": "A new user has been successfully linked",
  "action_datetime": "2024-06-03T19:10:43.419390",
  "environment": "production"
}
For setup guidance, refer to the Data Delivery section.
To activate the Notification Webhook, contact the ROOK support team or your account manager.
Callback URL Setup
The Callback URL Setup add-on enables clients to define a redirect URL for users after completing data source authorization. This add-on improves the user flow by guiding users back to the client’s APP or another designated view.
Usage example:
https://api.rook-connect.com/api/v1/client_uuid/123456789/user_id/UserTest12345/data_sources/authorizers?redirect_url=https://www.yourapp.com
To activate the Callback URL Setup, contact the ROOK support team or your account manager.
Connections Page
The Connections Page simplifies user authorization by presenting a pre-configured interface with buttons for supported data sources. This tool is ideal for sandbox testing and rapid development, but it is not recommended for production environments.
Key capabilities
- Pre-configured interface: Provides a dynamic view of supported data sources using the
/authorizersendpoint. - Configuration in ROOK Portal: Allows adjustments to displayed data sources and testing connectivity.
Production considerations
For production environments, clients should create a custom authorization interface by directly using the /authorizer
endpoint for each data_source. This endpoint returns:
- Authorization status and URL — Returns the user’s authorization status and, if the user is not authorized, an authorization URL to start the process.
More information is available in the API documentation.
Important: About the pre-configured interface
- The previous
/data_sources/authorizersendpoint is deprecated and should not be used for production flows.
Pre-Existing Data
The Pre-Existing Data add-on retrieves prior health data from users upon their initial connection. This includes up to:
- 7 days of pre-existing data for API-based sources.
- 0 to 180 days of pre-existing data for mobile-based sources via SDKs starting from SDK version 4.2.0, with 29 days enabled by default. For SDK versions earlier than 4.2.0, pre-existing data remains fixed at 29 days.
Key benefits
- Immediate insights: Pre-existing data enables instant analysis of user health metrics upon connection.
- ROOK Score calculation: A ROOK Score is calculated for each day of extracted pre-existing data, resulting in up to 7 scores for API-based sources and up to 180 scores for mobile-based sources using SDK 4.2.0 or later. These scores are delivered within 24 hours, ensuring all prior data is processed accurately.
- Seamless integration: Pre-existing data is delivered through the Data Webhook, using the same JSON structure as summaries and events, ensuring compatibility with existing systems.
Important notes
-
Source-specific variations:
- Polar: Does not provide physical or body summaries in pre-existing data.
- Whoop: Returns the same body summary for the past seven days, reflecting the most recent data available.
- Garmin: If the same user links twice within the same client account but with a different
user_id, pre-existing data is sent only on the first link. The second link receives no pre-existing data.
-
ROOK Score calculation: Each extracted day of pre-existing data contributes to a separate ROOK Score, ensuring comprehensive scoring and insights.
For additional details, visit the News Page.
In the Sandbox environment, Pre-Existing Data is activated by default, allowing teams to test the full flow without additional configuration. In Production, this add-on is not activated by default and must be activated manually before use. For activation and additional support, contact the ROOK support team.
Steps Events in API
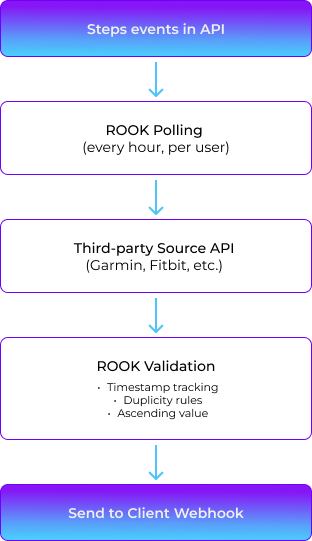
The Steps Events in API add-on enables the extraction of time-based step events using API-based data sources, offering granularity similar to that obtained through SDK-based data sources. It operates through a polling system that automatically queries third-party APIs such as Whoop, Oura, Garmin, Fitbit, Withings, or Polar every hour, applying validation rules to ensure data consistency, ascending order, and deduplication.
To activate this add-on in production, contact the ROOK support team or your account manager.
Functionality
| Capability | Description |
|---|---|
| Hourly extraction | A polling system queries third-party APIs every hour to retrieve accumulated step counts. |
| Data consistency | Extraction logic mirrors SDK behavior, with harmonized structure and frequency. |
| Duplicity rules | Only ascending values are accepted. If multiple sources are connected, the highest value is selected. When step values are zero or null, they fall back to the last known valid value. |
| Data structure | The event is delivered in steps_event format, including datetime, user_id, data_source, and accumulated steps. |
| Webhook delivery | Step events are delivered exclusively through the Data Webhook and cannot be fetched through an API request. |
| Notification Webhook (optional) | If a fetch failure occurs (timeout, authentication error, quota limit), a notification is sent to the client's Notification Webhook, when one is configured. |
Steps events flow diagram
Payload structure
Example steps_event payload
{
  "version": 2,
  "data_structure": "steps_event",
  "client_uuid": "",
  "user_id": "",
  "document_version": 1,
  "auto_detected": false,
  "physical_health": {
    "events": {
      "steps_event": [
        {
          "metadata": {
            "datetime_string": "2025-02-27T21:29:26.747000+05:00",
            "user_id_string": "10053949724",
            "sources_of_data_array": ["Garmin"],
            "was_the_user_under_physical_activity_bool": false
          },
          "steps": {
            "accumulated_steps_int": 8546
          },
          "non_structured_data_array": []
        }
      ]
    }
  }
}
Lab Data
Lab Data is a ROOK Connect add-on that turns laboratory reports into structured biomarker data. Your backend submits a PDF, JPEG, or PNG report to one endpoint. ROOK extracts, normalizes, and validates 46 biomarkers across five panels (CBC, CMP, Lipid, Thyroid, and HbA1c), maps each one to its LOINC code, and delivers the result to your Data Webhook in ROOK JSON or FHIR R4.
Lab Data processes each document asynchronously, so you do not need to build or maintain your own document processing infrastructure.
What does Lab Data do?
Lab Data turns the unstructured content of a laboratory report into consistent, structured data that is ready for your application.
During processing, ROOK:
- Extracts biomarkers from the document.
- Identifies the clinical panels included in the report.
- Normalizes biomarker names, units, and values.
- Maps each supported biomarker to its LOINC (Logical Observation Identifiers Names and Codes) code.
- Validates the consistency of each biomarker.
- Generates a structured response in either ROOK JSON or HL7 FHIR R4 (Fast Healthcare Interoperability Resources, release 4) format.
The entire processing pipeline runs within ROOK's infrastructure. Your application only needs to submit the document and receive the processed results through a Data Webhook.
Lab Data uses the same user_id you use for the rest of your ROOK integration, so you can correlate laboratory results with the wearable data of the same user.
How does Lab Data process a document?
Lab Data processes a laboratory document in four steps.
- Your application submits a laboratory document to the Lab Data endpoint.
- ROOK receives the document and places it into the processing queue.
- The document goes through the extraction, normalization, and validation pipeline.
- Once processing is complete, ROOK sends the structured results to your configured Data Webhook.
Lab Data processes documents asynchronously. The API response only confirms that the document has been successfully received. Processing results are delivered later through the configured Data Webhook.
Lab Data delivers processing results exclusively through a Data Webhook.
Before submitting your first laboratory document, make sure you have configured an HTTPS endpoint that is publicly accessible. ROOK sends an HTTP POST request to this endpoint each time a document is processed successfully.
If you have not configured a Data Webhook yet, see the Data Delivery section before continuing.
What can you build with Lab Data?
Lab Data is designed for applications that need to incorporate laboratory results without building their own document extraction and normalization system.
Common use cases include:
- Digital health platforms.
- Wellness applications.
- Preventive care programs.
- Remote patient monitoring solutions.
- Clinical research platforms.
- Systems that consolidate laboratory data from multiple providers.
Which documents can you submit to Lab Data?
Lab Data accepts laboratory reports in PDF, JPEG, or PNG format, up to 10 MB, that show the sample collection date and time.
Supported file formats
| File format | Typical documents | Processing |
|---|---|---|
| Digital reports issued by the laboratory, and scanned paper reports | Processed as submitted. Multi-page reports are supported. | |
| JPEG | Photos of a paper report taken with a phone camera | Converted to a single-page PDF before processing. |
| PNG | Screenshots of a report shown in a laboratory portal or app | Converted to a single-page PDF before processing. |
ROOK identifies the file type from the file content, not from its extension. Other formats, for example HEIC, WebP, GIF, TIFF, or Word documents, are rejected with 400 Bad Request. Each request contains one file: submit multi-page reports as a single PDF.
File size, sample collection date, and document quality
- The maximum supported file size is 10 MB. Larger files are rejected with
413 Payload Too Large. - The document must include a visible sample collection date and time. If either is missing or cannot be read, processing fails and no Data Webhook is sent.
- For the best results, submit complete, uncropped, legible, and correctly oriented documents, without shadows or reflections over the content.
Which panels and biomarkers does Lab Data support?
Lab Data returns structured results for 46 biomarkers across the following five panels. Each biomarker is delivered with its LOINC code and in its canonical unit, regardless of the unit printed on the document.
| Panel | panel_code_string | Panel LOINC code | Biomarkers |
|---|---|---|---|
| Complete Blood Count | CBC | 58410-2 | 21 |
| Comprehensive Metabolic Panel | CMP | 24323-8 | 14 |
| Lipid Panel | LIPID | 57698-3 | 5 |
| Thyroid Panel | THYROID | 24348-5 | 5 |
| HbA1c | HBA1C | 41995-2 | 1 |
Biomarkers outside the supported list are reported in rejected_biomarkers_array with the reason unsupported_biomarker. For the complete list of biomarkers, see Which biomarkers does Lab Data support?.
How do you submit a document to Lab Data?
Your backend submits each laboratory document to the Lab Data endpoint with a multipart/form-data request. Each request starts an asynchronous processing workflow and returns a unique identifier for the submitted document. There is no endpoint to check the processing status.
Lab Data endpoint
POST {base_url}/client_uuid/{client_uuid}/user_id/{user_id}
| Environment | Base URL |
|---|---|
| Sandbox | https://api.lab.rook-connect.review |
| Production | https://api.lab.rook-connect.com |
Lab Data is activated separately for each environment.
| Path parameter | Description |
|---|---|
client_uuid | The client identifier assigned by ROOK during onboarding. It must match the client_uuid of the credentials in the Authorization header. |
user_id | The identifier of the user associated with the document, defined by your application. Use the same user_id you use in the rest of your ROOK integration. |
Lab Data authentication
Lab Data uses HTTP Basic authentication with your client_uuid as the username and your secret_key as the password.
Authorization: Basic {Base64Encoded(client_uuid:secret_key)}
Your secret_key grants access to your ROOK integration. Submit documents from your backend, never directly from a web browser or a mobile application where the credentials would be exposed to end users.
Lab Data request fields
The Lab Data request uses multipart/form-data with the following fields.
| Field | Type | Required | Description |
|---|---|---|---|
file | File | Yes | Laboratory document in PDF, JPEG, or PNG format. Maximum file size: 10 MB. |
timezone | String | Yes | UTC offset of the sample collection time, in ISO-8601 offset format: -05:00, +01:00, or Z. Values such as UTC, EST, or -5:00 are rejected. |
curl -X POST \
"https://api.lab.rook-connect.review/client_uuid/$ROOK_CLIENT_UUID/user_id/$USER_ID" \
-u "$ROOK_CLIENT_UUID:$ROOK_SECRET_KEY" \
-F "file=@/path/to/laboratory_result.pdf" \
-F "timezone=-05:00"
The example reads your client_uuid and secret_key from the ROOK_CLIENT_UUID and ROOK_SECRET_KEY environment variables, so the credentials stay out of your source code and shell history. The -u option builds the Authorization: Basic header from them.
For the sample collection time, ROOK uses the time zone identified in the document first, and the timezone field when the document does not include one. If neither is available, timestamps are returned without time zone information.
Lab Data response and error codes
A valid Lab Data request returns HTTP 200 OK:
{
  "document_id": "3fa85f64-5717-4562-b3fc-2c963f66afa6",
  "status": "received"
}
Store the document_id. The same value arrives in the Data Webhook as laboratory_data.metadata.document_id_string.
| Status code | Description |
|---|---|
200 OK | The document was received and processing has started. |
400 Bad Request | A required field is missing, the timezone format is invalid, the body is empty, or the file type is not supported. |
401 Unauthorized | The Authorization header is missing, or the credentials are not valid. |
403 Forbidden | {"error": "The credentials do not belong to this client"}: the client_uuid in the path does not match your credentials. {"error": "Lab data processing not enabled for this client"}: Lab Data is not activated in this environment. Activate it from your ROOK Portal, or contact the ROOK Support team. |
413 Payload Too Large | The file exceeds 10 MB. |
415 Unsupported Media Type | The request was not sent as multipart/form-data. |
500 Internal Server Error | An unexpected error occurred. Retry the request. If the issue persists, contact ROOK Support. |
Error responses include an error field, or a message field for 401, that describes the cause.
If a document cannot be processed, or your organization already submitted a file with exactly the same content, no Data Webhook is sent. To investigate one of these cases, contact ROOK Support with the document_id.
What does Lab Data deliver to your Data Webhook?
ROOK delivers each processed Lab Data document to your Data Webhook with data_structure: "lab_result_event", using the same delivery, HMAC validation, and retries as the rest of your Data Webhooks. See Data Delivery.
Example ROOK JSON payload
{
  "client_uuid": "c2f4ce3b-8e6d-4b5f-9a3e-1d2c3b4a5f6e",
  "user_id": "user_1234",
  "version": 2,
  "document_version": 1,
  "data_structure": "lab_result_event",
  "laboratory_data": {
    "metadata": {
      "datetime_string": "2026-03-15T08:30:00-05:00",
      "performing_lab_string": "Example Clinical Laboratory - North Branch",
      "is_fasting_bool": true,
      "user_id_string": "user_1234",
      "document_id_string": "3fa85f64-5717-4562-b3fc-2c963f66afa6",
      "sources_of_data_array": ["Example Clinical Laboratory - North Branch"]
    },
    "panels_array": [
      {
        "panel_name_string": "Complete Blood Count",
        "panel_code_string": "CBC",
        "panel_loinc_code_string": "58410-2",
        "biomarkers_array": [
          {
            "biomarker_name_string": "Hemoglobin",
            "loinc_code_string": "718-7",
            "value_float": 14.5,
            "unit_string": "g/dL",
            "canonical_unit_string": "g/dL",
            "reference_range_low_float": 12.0,
            "reference_range_high_float": 17.5,
            "reference_range_unit_string": "g/dL",
            "status_string": "normal",
            "confidence_float": 0.98,
            "plausibility_flag": false
          }
        ]
      }
    ],
    "rejected_biomarkers_array": [
      {
        "biomarker_name_string": "Vitamin B12",
        "loinc_code_string": "2132-9",
        "extracted_value_string": "250.0",
        "extracted_unit_string": "pg/mL",
        "reason_string": "unsupported_biomarker",
        "confidence_float": 0.93
      }
    ]
  }
}
These Lab Data fields are the ones your webhook handler needs first:
| Field | Use it to |
|---|---|
data_structure | Route Lab Data results. The value is always lab_result_event. |
laboratory_data.metadata.document_id_string | Match the result with the document_id returned at submission. |
status_string | Read the interpretation of each biomarker: normal, low, high, critical_low, or critical_high. |
plausibility_flag | Identify values that are unusual or inconsistent with a related biomarker, and review them before using them in clinical decisions. |
value_corrected_bool / original_value_float | Identify values that ROOK adjusted during validation to resolve a unit conversion inconsistency. Present only when an adjustment happened. |
reason_string | Understand why a biomarker is in rejected_biomarkers_array: low_confidence, unsupported_biomarker, unknown_unit, implausible_value, or not_mapped. |
FHIR R4 output. When FHIR R4 output is activated, ROOK delivers Lab Data results as an HL7 FHIR R4 Bundle in laboratory_data.clinical_ready, instead of panels_array and rejected_biomarkers_array. FHIR R4 output for Lab Data requires the Clinical Ready add-on. See How do you activate Lab Data?.
For a description of every field, the FHIR R4 structure, and complete examples in both formats, see the ROOK Knowledge Base article What do Lab Data results look like in ROOK JSON and FHIR R4?. If a result does not arrive, see Why didn't my Lab Data result arrive?.
For use cases, supported documents, activation steps, and frequently asked questions, see the Lab Data changelog entry and FAQ.
What does Lab Data not do?
- Lab Data does not diagnose conditions, interpret results clinically, or recommend treatment. It structures what the laboratory report contains.
- Lab Data does not expose an endpoint to check the processing status. Results arrive only through your Data Webhook.
- Lab Data returns structured results only for the 46 supported biomarkers. Other biomarkers are reported in
rejected_biomarkers_array. - Lab Data does not process a document again when your organization submits a file with exactly the same content.
How do you activate Lab Data?
To activate Lab Data, you can enable it directly from your ROOK Portal or contact the ROOK Support team or your account manager for assistance.
FHIR R4 output for Lab Data is activated the same way, from your ROOK Portal or through the ROOK Support team or your account manager. To activate FHIR R4 output, your organization needs the Clinical Ready add-on. Without FHIR R4 output, Lab Data delivers results in ROOK JSON.
Clinical Ready Beta
The EHR/EMR Clinical Ready add-on transforms your users' normalized health summaries into a FHIR R4-compliant document, annotated with LOINC codes and UCUM units. Every time a new summary is generated or updated, ROOK consolidates the available health data and delivers a FHIR Bundle through your existing Data Webhook — no additional integration required.
How it works
ROOK reads from three summary types and maps each metric that has a LOINC code into an Observation resource. Metrics without a LOINC code are excluded.
| Source | Clinical data included |
|---|---|
body_summary | Weight, height, BMI, blood pressure, resting HR, SpO₂, caloric intake |
physical_summary | Steps, distance, average HR, VO₂max, SpO₂ |
sleep_summary | Sleep duration and stages, breathing rate, SpO₂, time to fall asleep |
Each document is versioned: a new version is generated only when the clinical content changes. If no new data arrives, the existing document is preserved.
Payload structure
The FHIR Bundle is delivered through the Data Webhook with data_structure: "clinical_ready". The bundle follows the FHIR R4 collection type and includes one Patient resource and one Observation per mapped metric.
Example clinical_ready payload
{
  "version": 1,
  "document_version": 1,
  "data_structure": "clinical_ready",
  "user_id": "user123",
  "client_uuid": "client456",
  "clinical_ready": {
    "metadata": {
      "datetime_string": "2025-10-13T18:00:00.000Z",
      "user_id": "user123",
      "sources_of_data_array": ["Apple Health"],
      "fhir_export_ready": true,
      "fhir_export_completed_at": "2025-10-13T08:00:00.000Z"
    },
    "clinical_ready_data": {
      "resourceType": "Bundle",
      "id": "rook-clinical-bundle-user123",
      "type": "collection",
      "timestamp": "2025-10-13T18:00:00.000Z",
      "meta": {
        "profile": ["http://hl7.org/fhir/StructureDefinition/Bundle"],
        "source": "rook-clinical-normalization-engine",
        "tag": [
          {
            "system": "https://api.tryrook.io/fhir/tags",
            "code": "clinical_ready_export",
            "display": "client=client456 user=user123 fhir_export_ready=true"
          }
        ]
      },
      "entry": [
        {
          "fullUrl": "urn:uuid:patient-user123",
          "resource": {
            "resourceType": "Patient",
            "id": "patient-user123",
            "identifier": [
              {
                "system": "https://api.tryrook.io/users",
                "value": "user123"
              }
            ],
            "meta": { "source": "rook-clinical-normalization-engine" }
          }
        },
        {
          "fullUrl": "urn:uuid:obs-heart-rate-avg",
          "resource": {
            "resourceType": "Observation",
            "id": "obs-heart-rate-avg",
            "status": "final",
            "category": [
              {
                "coding": [
                  {
                    "system": "http://terminology.hl7.org/CodeSystem/observation-category",
                    "code": "vital-signs"
                  }
                ]
              }
            ],
            "code": {
              "coding": [
                {
                  "system": "http://loinc.org",
                  "code": "8867-4",
                  "display": "Heart rate"
                }
              ]
            },
            "subject": { "reference": "urn:uuid:patient-user123" },
            "effectivePeriod": {
              "start": "2025-10-13T00:00:00.000Z",
              "end": "2025-10-13T23:59:59.999Z"
            },
            "meta": { "source": "rook-clinical-normalization-engine" },
            "extension": [
              {
                "url": "https://api.tryrook.io/fhir/extensions/observation-context",
                "valueString": "daily_average"
              }
            ],
            "valueQuantity": {
              "value": 94,
              "unit": "beats/min",
              "system": "http://unitsofmeasure.org",
              "code": "/min"
            }
          }
        },
        {
          "fullUrl": "urn:uuid:obs-steps",
          "resource": {
            "resourceType": "Observation",
            "id": "obs-steps",
            "status": "final",
            "category": [
              {
                "coding": [
                  {
                    "system": "http://terminology.hl7.org/CodeSystem/observation-category",
                    "code": "activity"
                  }
                ]
              }
            ],
            "code": {
              "coding": [
                {
                  "system": "http://loinc.org",
                  "code": "55423-8",
                  "display": "Number of steps in unspecified time Pedometer"
                }
              ]
            },
            "subject": { "reference": "urn:uuid:patient-user123" },
            "effectivePeriod": {
              "start": "2025-10-13T00:00:00.000Z",
              "end": "2025-10-13T23:59:59.999Z"
            },
            "meta": { "source": "rook-clinical-normalization-engine" },
            "valueQuantity": {
              "value": 11701,
              "unit": "steps",
              "system": "http://unitsofmeasure.org",
              "code": "{steps}"
            }
          }
        },
        {
          "fullUrl": "urn:uuid:obs-sleep-duration",
          "resource": {
            "resourceType": "Observation",
            "id": "obs-sleep-duration",
            "status": "final",
            "category": [
              {
                "coding": [
                  {
                    "system": "http://terminology.hl7.org/CodeSystem/observation-category",
                    "code": "survey"
                  }
                ]
              }
            ],
            "code": {
              "coding": [
                {
                  "system": "http://loinc.org",
                  "code": "93832-4",
                  "display": "Sleep duration"
                }
              ]
            },
            "subject": { "reference": "urn:uuid:patient-user123" },
            "effectivePeriod": {
              "start": "2025-10-12T23:09:16.916Z",
              "end": "2025-10-13T05:17:17.486Z"
            },
            "meta": { "source": "rook-clinical-normalization-engine" },
            "valueQuantity": {
              "value": 21145,
              "unit": "s",
              "system": "http://unitsofmeasure.org",
              "code": "s"
            }
          }
        }
      ]
    }
  }
}
The full bundle includes one Observation per mapped metric across all available summaries. The preceding examples illustrate the three Observation categories used: vital-signs (body metrics), activity (physical data), and survey (sleep data).
To activate Clinical Ready, contact the ROOK support team or your account manager.
Medical Device Metadata
Medical Device Metadata enriches supported health events with a device_source_data_array object that identifies the physical device that captured each measurement and, where verified, its regulatory status (FDA / EU CE).
For use cases, rules, and frequently asked questions, see the Medical Device Metadata changelog entry.
How do clients enable Medical Device Metadata?
Clients enable Medical Device Metadata themselves in the ROOK Portal. It is not activated by default.
- Sign in to the ROOK Portal and go to Products → ROOK Connect.
- Find Medical Device Metadata.
- Turn the toggle on. Turn it off at any time to stop receiving the field.
How is Medical Device Metadata delivered?
Medical Device Metadata is delivered inside the webhooks that clients already receive from ROOK Connect. It does not need a new endpoint or a new integration. When Medical Device Metadata is on, ROOK adds device_source_data_array at the root of each supported event, at the same level as body_health. When Medical Device Metadata is off, the webhook payload does not change.
Which data sources and events include Medical Device Metadata?
Medical Device Metadata covers 5 event types from 5 data sources. SDK data sources (Apple Health, Health Connect, and Samsung Health) deliver these events with the body_ prefix; API data sources (Withings and Dexcom) deliver them without it.
| Event | Apple Health | Health Connect | Samsung Health | Withings | Dexcom |
|---|---|---|---|---|---|
body_blood_glucose_event / blood_glucose_event | ✅ | ✅ | ✅ | — | ✅ |
body_blood_pressure_event / blood_pressure_event | ✅ | ✅ | ✅ | ✅ | — |
body_oxygenation_event / oxygenation_event | ✅ | ✅ | ✅ | ✅ | — |
body_temperature_event / temperature_event | ✅ | ✅ | ✅ | ✅ | — |
body_ecg_event / ecg_event | ✅ | — | — | ✅ | — |
ECG is not available from Health Connect or Samsung Health.
What fields does device_source_data_array contain?
device_source_data_array contains one item per device that contributed to the event. Each item has these fields:
| Field | Type | Description |
|---|---|---|
device_category_string | string | null | Product category of the device or ingestion channel (for example, Blood Pressure Monitor, Activity Tracker, Continuous Glucose Monitor, Watch, HealthKit Apple). |
manufacturer_string | string | null | Device manufacturer (for example, Apple, Withings, Dexcom). |
model_string | string | null | Commercial model name (for example, Apple Watch Series 9, BPM Core). |
medical_device_bool | boolean | null | Regulatory status of this model for the measured function. true: at least one verified FDA or EU CE record exists (see regulatory_info_array). null: no verified record is available; this does not mean the device is not a medical device. false: reserved, not returned at this time. |
regulatory_info_array | array | Verified regulatory records that support medical_device_bool: true. Empty when there is no verified record. |
What fields does regulatory_info_array contain?
regulatory_info_array contains one item per verified regulatory record. A model authorized in both the United States and the European Union has two items.
| Field | Type | Description |
|---|---|---|
regulatory_system_string | string | FDA (US Food and Drug Administration) or EU_CE (European Union CE marking). |
regulated_function_string | string | Function covered by the record: glucose, blood_pressure, spo2, temperature, or ecg. |
regulatory_pathway_string | string | null | FDA: 510k, de_novo, or pma. EU: MDR or MDD_legacy. |
authorization_id_string | string | null | Public regulatory identifier (for example, an FDA 510(k) number or an EU certificate / Basic UDI-DI), when one can be verified for this exact model. |
access_type_string | string | null | Access condition: otc, prescription, or professional. |
What does medical_device_bool mean?
medical_device_bool indicates whether a verified FDA or EU CE record exists for the device model and the function measured in that event. It is evaluated per manufacturer, model, and function, never for the device as a whole.
| Value | Meaning |
|---|---|
true | At least one verified FDA or EU CE record exists for this model and function. The records are in regulatory_info_array. |
null | No verified record is available for this model and function. null does not mean the device is not a medical device. |
false | Reserved for functions explicitly evaluated as non-medical. Not returned in this release. |
Example: an ECG event from an Apple Watch Series 9 returns true, because the ECG app has FDA 510(k) clearance K201525. An SpO2 event from the same watch returns null.
What does a webhook look like with and without Medical Device Metadata?
The only difference in the webhook is the added device_source_data_array. The rest of the payload stays the same. The following example is a blood_pressure_event from a Withings BPM Core, with synthetic values.
Without Medical Device Metadata
{
  "version": 2,
  "data_structure": "blood_pressure_event",
  "user_id": "testUser",
  "body_health": {
    "events": {
      "blood_pressure_event": [
        {
          "blood_pressure": {
            "blood_pressure_avg_object": {
              "systolic_mmHg_int": 120,
              "diastolic_mmHg_int": 80
            }
          }
        }
      ]
    }
  }
}
With Medical Device Metadata
{
  "version": 2,
  "data_structure": "blood_pressure_event",
  "user_id": "testUser",
  "body_health": { "...": "..." },
  "device_source_data_array": [
    {
      "device_category_string": "Blood Pressure Monitor",
      "model_string": "BPM Core",
      "manufacturer_string": "Withings",
      "medical_device_bool": true,
      "regulatory_info_array": [
        {
          "regulatory_system_string": "EU_CE",
          "regulated_function_string": "blood_pressure",
          "regulatory_pathway_string": "MDR",
          "authorization_id_string": null,
          "access_type_string": "otc"
        }
      ]
    }
  ]
}
Regulatory information is provided for informational and reference purposes only and applies only to the specific function and jurisdiction indicated. It does not extend to or imply regulatory approval, clearance, or certification of your application, product, or service and does not constitute legal, medical, or regulatory advice.
Where can clients find the supported models and usage rules?
The list of device models with verified regulatory records, where the regulatory information comes from, and answers to common questions about Medical Device Metadata are in the Medical Device Metadata changelog entry and FAQ.
User Health Profile
The User Health Profile add-on transforms synchronized wearable data into a structured health profile.
Instead of processing individual wearable metrics, your application receives a consolidated profile organized into five health domains: activity, sleep, cardio, recovery, and body.
Each profile includes normalized metrics, health scores, trends, and personalized observations generated from the user's recent wearable data.
The profile is generated on demand and delivered asynchronously through your configured Data Webhook.
How it works
The integration follows an asynchronous workflow.
- Your application requests a User Health Profile.
- ROOK analyzes the user's synchronized wearable data.
- ROOK generates the User Health Profile.
- ROOK delivers the generated profile to your configured Data Webhook.
Profiles are generated only when your application requests one. ROOK does not regenerate a profile automatically when new wearable data arrives — request a new profile to pick up the new data.
The same applies after a user connects a data_source: request the profile once their Pre-Existing Data has been synchronized.
User Health Profile delivers generated profiles exclusively through a Data Webhook. The endpoint does not return the profile.
If you have not configured a Data Webhook yet, see the Data Delivery section before continuing.
Requirements
Before requesting a User Health Profile, make sure that:
- The user has connected at least one supported data_source through ROOK Connect.
- The user's wearable data has been synchronized.
- A Data Webhook is configured.
- User Health Profile is activated for your organization.
Generate a User Health Profile
Request a profile using the following endpoint. The endpoint validates the request and immediately starts asynchronous processing.
Endpoint
POST https://api.rook-connect.<com | review>/api/v2/user_profile
Authentication
User Health Profile supports the authentication method basic authentication, supported for existing ROOK integrations.
Authorization: Basic <base64(client_uuid:password)>
ROOK resolves the client_uuid from these credentials. Do not send it in the request body.
Request body
Requests must be sent using application/json.
| Field | Type | Required | Description |
|---|---|---|---|
user_id | String | Yes | The identifier of the user associated with the profile. This value is defined by your application. |
{
  "user_id": "user-12345"
}
Example request
curl -X POST \
"https://api.rook-connect.com/api/v2/user_profile" \
-H "Authorization: Basic <base64(client_uuid:password)>" \
-H "Content-Type: application/json" \
-d '{"user_id": "user-12345"}'
The generated profile is not returned by the endpoint. Results are delivered later through the configured Data Webhook.
Response
If the request is valid, the endpoint returns an HTTP 202 Accepted response.
{
  "message": "User profile request queued",
  "request_id": "6df0d4fd-c5d8-4e16-8e0d-xxxxxxxxxxxx"
}
The request_id uniquely identifies the profile generation request.
Store this identifier to correlate the request with the profile delivered through the Data Webhook. The same value arrives in the payload as metadata.request_id_string.
Response codes
| Status code | Description |
|---|---|
202 Accepted | The request was successfully queued for asynchronous processing. The response includes a request_id that can be used to correlate the request with the profile delivered later by webhook. |
400 Bad Request | The request body is not valid JSON, or user_id is missing or empty. The response uses the standard error format, with exception indicating that user_id is required. |
401 Unauthorized | Authentication failed. The exception field is "The client_uuid or password are incorrect" when the Authorization header is absent or the Basic credentials are invalid, and "Unsupported authorization type" when an unsupported authentication scheme is used. |
403 Forbidden | User Health Profile is not activated for your organization. The response returns feature_not_included in the exception field. Contact the ROOK team to activate the add-on. |
422 Unprocessable Entity | The request body is valid JSON but cannot be processed. The exception field is "request body must be a JSON object" when the body is not a JSON object, or "user_id must be a string" when user_id is present but is not a string. |
429 Too Many Requests | The request exceeded the applicable rate limit described in Rate limits. The response returns rate_limit_exceeded in the exception field and includes rate-limit headers indicating the remaining quota and how long to wait before retrying. |
500 Internal Server Error | An internal error prevented the request from being accepted or queued for processing. Retry the request. If the issue persists, contact ROOK Support. |
Profile generation
ROOK analyzes the user's synchronized wearable data, primarily from the previous seven days, and generates five health domains.
Each domain may contain:
- Aggregated metrics
- Health score
- Health level
- Trend
The generated profile also contains an overall score and personalized observations.
Health levels
Every score is classified into a health level.
| Score | Level |
|---|---|
| 80–100 | Optimal |
| 65–79 | Good |
| 50–64 | Moderate |
| 30–49 | Poor |
| Below 30 | Critical |
Health domains expose this value as level_string. The overall object exposes the same concept as category_string.
Scores and data confidence
Each domain reports two independent values:
score_int— how good the available data looks, from 0 to 100.confidence_score_int— how complete and reliable the data behind that score is, from 0 to 100.
Because the two values are independent, a high score can come with low confidence:
{
  "score_int": 85,
  "level_string": "Optimal",
  "confidence_score_int": 35
}
In this example the available metrics look healthy, but they cover only a small part of the analysis window. Read a low confidence_score_int as a signal to avoid strong conclusions, not as a poor result.
Missing metrics lower confidence_score_int, never score_int. See Missing data.
Receive the User Health Profile
When processing is complete, ROOK sends the generated profile to your configured Data Webhook as an HTTP POST request with a JSON payload.
Your endpoint should respond with one of the following status codes:
200 OK201 Created202 Accepted
If delivery fails, ROOK retries the webhook automatically. Retry intervals match the ones described in the Data Delivery section.
Payload structure
The payload contains the generated User Health Profile together with metadata that identifies the request.
Example user_profile payload
{
  "version": 1,
  "document_version": 1,
  "data_structure": "user_profile",
  "client_uuid": "xxxxxxxx-xxxx-xxxx-xxxx-xxxxxxxxxxxx",
  "user_id": "user",
  "user_profile_data": {
    "metadata": {
      "datetime_string": "2026-09-10T00:00:00.000000-05:00",
      "user_id_string": "user",
      "request_id_string": "xxxxxxxx-xxxx-xxxx-xxxx-xxxxxxxxxxxx"
    },
    "demographics": {
      "sex_string": null,
      "birth_year_int": null,
      "country_string": null,
      "utc_offset_seconds_int": -18000
    },
    "profiles": {
      "activity": {
        "score_int": 75,
        "level_string": "Good",
        "trend_string": "improving",
        "metrics": {
          "daily_steps_avg_int": 6710,
          "active_avg_minutes_int": 152,
          "activity_calories_avg_kcal_float": 223,
          "activity_frequency_int": 4,
          "confidence_score_int": 100
        }
      },
      "sleep": {
        "score_int": 77,
        "level_string": "Good",
        "trend_string": "improving",
        "metrics": {
          "sleep_duration_avg_hours_float": 7.72,
          "sleep_efficiency_1_100_avg_int": 99,
          "sleep_consistency_dict": {
            "score_int": 14,
            "start": {
              "variability_int": 57,
              "typical_interval_array": [
                "22:26",
                "23:00"
              ]
            },
            "end": {
              "variability_int": 57,
              "typical_interval_array": [
                "05:29",
                "06:49"
              ]
            }
          },
          "time_in_bed_avg_hours_float": 7.82,
          "confidence_score_int": 100
        }
      },
      "cardio": {
        "score_int": 98,
        "level_string": "Optimal",
        "trend_string": "stable",
        "metrics": {
          "hr_resting_avg_int": 53,
          "hrv_avg_float": null,
          "hrv_type_string": null,
          "active_duration_avg_seconds_float": 9142,
          "hr_max_avg_int": 126,
          "hr_min_avg_int": 49,
          "confidence_score_int": 80
        }
      },
      "recovery": {
        "score_int": 99,
        "level_string": "Optimal",
        "trend_string": "stable",
        "metrics": {
          "hr_resting_avg_int": null,
          "hrv_avg_float": 73.71,
          "hrv_type_string": "rmssd",
          "hrv_baseline_delta_float": 5.88,
          "sleep_debt_hours_float": 1.94,
          "confidence_score_int": 66
        }
      },
      "body": {
        "score_int": null,
        "level_string": null,
        "trend_string": null,
        "metrics": null
      }
    },
    "overall": {
      "health_score_int": 87,
      "category_string": "Optimal",
      "trend_string": "improving",
      "confidence_score_int": 69
    },
    "observations": [
      {
        "text_string": "Your overall health score remains strong.",
        "confidence_int": 69
      },
      {
        "text_string": "Your sleep duration is within a healthy range.",
        "confidence_int": 100
      },
      {
        "text_string": "Your recovery score is within an optimal range.",
        "confidence_int": 66
      }
    ]
  }
}
Root object
| Field | Description |
|---|---|
version | Payload version. |
document_version | Version of the generated profile. This value increases each time ROOK recalculates the profile. |
data_structure | Always user_profile. |
user_id | External user identifier. |
client_uuid | ROOK client identifier. |
user_profile_data | Generated User Health Profile. |
metadata
The metadata object identifies the generated profile.
| Field | Description |
|---|---|
datetime_string | Date of the generated profile, set to 00:00:00 in the user's UTC offset. This is the date the profile covers, not the time the request was made. When no UTC offset is available for the user, ROOK uses +00:00. |
user_id_string | External user identifier. |
request_id_string | Identifier of the profile generation request. |
demographics
The demographics object contains the demographic information available for the user. It may include sex, birth year, country, and UTC offset.
profiles
The profiles object groups the generated health information into five domains.
| Domain | Description |
|---|---|
| Activity | Daily movement and activity metrics. |
| Sleep | Sleep duration and quality metrics. |
| Cardio | Cardiovascular health metrics. |
| Recovery | Recovery and readiness metrics. |
| Body | Body measurements and body composition metrics. |
Each domain object has the following structure.
| Field | Description |
|---|---|
metrics | Aggregated metrics for the domain, together with their data coverage. |
score_int | Domain score, from 0 to 100. null when there is not enough data. |
level_string | Health level derived from score_int. null when there is not enough data. |
trend_string | Change compared with the previous profile. null when no comparison is possible. |
overall
The overall object summarizes the user's health using the available health domains.
| Field | Description |
|---|---|
health_score_int | Overall score, from 0 to 100, combining the available health domains. |
category_string | Health level derived from health_score_int. Health domains express the same concept as level_string. |
confidence_score_int | Confidence in the data behind the overall score, from 0 to 100. |
trend_string | Change compared with the previous profile. null when no comparison is possible. |
Observations
The observations array contains personalized observations generated from the available wearable data. Observations may identify positive patterns, trends, risks, and relationships between health domains.
Each observation exposes two fields.
| Field | Description |
|---|---|
text_string | The observation, in English. |
confidence_int | Data coverage behind this observation, from 0 to 100. It reflects the quality of the data that triggered the observation, not diagnostic certainty. |
"observations": [
  { "text_string": "Your activity patterns are consistent", "confidence_int": 80 },
  { "text_string": "Your sleep schedule is consistent", "confidence_int": 85 }
]
There is no maximum number of observations. ROOK returns every observation whose conditions are met, after removing duplicates and resolving conflicting observations. Use confidence_int to apply your own visibility threshold.
Missing data
User Health Profile does not interpret missing metrics as poor health.
If a metric is unavailable, ROOK uses the remaining available metrics whenever possible.
If there is not enough information to calculate a domain, the corresponding values are returned as null.
{
  "score_int": null,
  "level_string": null,
  "trend_string": null
}
If there is not enough data to generate any domain, ROOK does not generate or deliver a User Health Profile.
Rate limits
The User Health Profile endpoint applies the following limits per user and client. The daily window is a rolling 24-hour period starting from the user's first request, not a calendar-day reset.
| Limit | Value |
|---|---|
| Requests per hour | 3 |
| Requests per 24-hour window | 30 |
Requests that exceed these limits return 429 Too Many Requests with the body:
{
  "error": "Too Many Requests",
  "exception": "rate_limit_exceeded",
  "path": "/api/v2/user_profile",
  "method": "POST"
}
When a request is rejected with 429, the response includes the following headers.
| Header | Description |
|---|---|
X-RateLimit-Limit-Hour | Maximum requests allowed per hour. |
X-RateLimit-Remaining-Hour | Requests still available in the current hour. |
X-RateLimit-Limit-Day | Maximum requests allowed per day. |
X-RateLimit-Remaining-Day | Requests still available in the current day. |
Retry-After | Seconds to wait before retrying. Points to the end of whichever window is blocking the request. |
To activate User Health Profile, contact the ROOK support team or your account manager.
Health Monitoring Beta
Health Monitoring lets you know when a user's health signals move outside what's normal for them, without having to process the full data stream yourself to detect it.
ROOK calculates a baseline per user and per signal from that user's own historical data. You configure how much deviation from that baseline — or a fixed range, depending on the signal — should trigger a notice, and ROOK sends an alert through your existing Data Webhook when a measurement falls outside it.
This is a health-tracking feature, not an emergency or diagnostic system.
Signals
Health Monitoring evaluates five signals, using one of two threshold methods.
| Signal | Threshold method | Near-immediate alert | Daily summary |
|---|---|---|---|
| Resting heart rate | Baseline + deviation % | — | ✅ |
| HRV | Baseline + deviation % | — | ✅ |
| Resting breathing rate | Baseline + deviation % | — | ✅ |
| Oxygenation (SpO₂) | Fixed range | ✅ | ✅ |
| Sleep duration | Fixed range | — | ✅ |
- Heart rate is read from the resting-state reading only; heart rate during physical activity is not evaluated.
- An alert is only evaluated when the underlying measurement is not null.
The daily summary is triggered by the arrival of that day's sleep data. If a user's sleep is never synced for a given day, no summary is produced for that day — and the other four signals are not reported either, even if one of them fell outside its threshold.
How the baseline is calculated
The baseline applies to resting heart rate, HRV, and resting breathing rate — the two fixed-range signals don't use one. ROOK calculates it per user and per signal, in this order of preference:
- From the user's pre-existing data, if available at connection time.
- Otherwise, from the data the user generates after connecting.
A baseline closes once ROOK has 7 valid days of that signal, looked for within a 30-day window. A user who does not produce 7 valid days in that time keeps an open baseline, and ROOK keeps trying as new data arrives.
Until a baseline exists for a signal, that signal does not generate alerts for that user.
Configuring thresholds
Each signal can be configured at two scopes:
| Scope | Applies to |
|---|---|
| General | Every user of the client without a specific override for that signal. |
| Specific | One user, taking precedence over the general rule. |
When resolving which rule to apply for a given user and signal, ROOK follows this precedence: user-specific rule > client general rule > ROOK default.
Configure both scopes through the Health Monitoring Rules endpoint:
GET /api/v2/health_monitoring/rules— read the stored general rule, or a specific user's rule. Returns exactly what is stored, not the resolved effective threshold.PUT /api/v2/health_monitoring/rules— create or fully replace the rule for either scope.
If neither a general nor a specific rule is configured for a signal, ROOK falls back to its own default:
| Signal | Default |
|---|---|
| Resting heart rate | −15% / +10% of baseline |
| HRV | −30% of baseline (no upper bound) |
| Resting breathing rate | −15% / +10% of baseline |
| Oxygenation (SpO₂) | Below 92% |
| Sleep duration | Below 6h (21,600s) or above 9h (32,400s) |
If your integration depends on specific thresholds, configure them explicitly through the rules endpoint rather than relying on ROOK's defaults.
How it works
- ROOK ingests and normalizes wearable data as usual.
- The monitoring engine resolves the effective threshold for that user and signal — specific rule, then general rule, then ROOK default — and compares it against the baseline where one applies.
- A SpO₂ measurement outside its effective range triggers a near-immediate
alert_event. - When that day's sleep data arrives, ROOK evaluates the day's signals (including HRV) against their effective thresholds, using the user's local time zone to delimit the day, and consolidates the ones that fell outside into a single
alert_summary. - If a more complete version of the same day arrives later, ROOK re-evaluates it and sends a new version of that summary. See Summary versions.
- Both document types are delivered through your existing Data Webhook — no separate webhook is required.
Payload structure
alert_event
Emitted when a SpO₂ measurement outside the effective range is received. Oxygenation is the only signal that produces one, so alert_signals_array always has exactly one element. Unlike alert_summary, this document carries no deviation_* fields — SpO₂ is a fixed-range signal.
Example alert_event payload
{
  "client_uuid": "demoClientUUID",
  "user_id": "demoUserId",
  "version": 2,
  "document_version": 1,
  "data_structure": "alert_event",
  "metadata": {
    "datetime_string": "2026-07-13T21:07:14.402999Z",
    "sources_of_data_array": ["Apple Health"],
    "user_id_string": "demoUserId"
  },
  "alerts": {
    "triggered_at_string": "2026-07-13T21:07:14.402999Z",
    "alert_signals_array": [
      {
        "signal_type_string": "oxygenation",
        "measured_value_float": 91.0,
        "baseline_value_float": null,
        "threshold_type_string": "fixed_range",
        "threshold_min_float": 92.0,
        "threshold_max_float": null,
        "breach_direction_string": "below",
        "unit_string": "percentage",
        "is_default_config_bool": false,
        "source_of_data_string": "Apple Health",
        "measured_at_string": "2026-07-13T21:07:14.402999Z"
      }
    ]
  }
}
alert_summary
The result of evaluating one day for one user. ROOK produces it when that day's sleep data arrives, and sends it again as a new version if a more complete version of the day arrives later — see Summary versions.
You receive a summary for every day ROOK was able to evaluate, not only for days with a breach: a day where nothing fell outside its thresholds arrives with total_alerts_int: 0. Days ROOK could not evaluate — no sleep data, or no baseline yet — produce no summary at all.
alert_signals_array always carries all five signals, in a fixed order. A signal that did not breach is present with measured_value_float and its other fields set to null. Read total_alerts_int, or filter on measured_value_float != null, to find the ones that actually breached — do not rely on the array's length.
Example alert_summary payload
{
  "client_uuid": "demoClientUUID",
  "user_id": "demoUserId",
  "version": 2,
  "document_version": 1,
  "data_structure": "alert_summary",
  "metadata": {
    "datetime_string": "2026-07-13T23:59:59.999-06:00",
    "sources_of_data_array": ["Apple Health"],
    "user_id_string": "demoUserId",
    "summary_date_string": "2026-07-13",
    "user_timezone_string": "America/Mexico_City"
  },
  "alerts": {
    "total_alerts_int": 2,
    "summary_period_start_string": "2026-07-13T00:00:00.000-06:00",
    "summary_period_end_string": "2026-07-13T23:59:59.999-06:00",
    "alert_signals_array": [
      {
        "signal_type_string": "resting_heart_rate",
        "measured_value_float": 71.0,
        "baseline_value_float": 60.0,
        "threshold_type_string": "baseline_deviation",
        "deviation_below_percent_float": 15.0,
        "deviation_above_percent_float": 10.0,
        "threshold_min_float": 51.0,
        "threshold_max_float": 66.0,
        "breach_direction_string": "above",
        "unit_string": "bpm",
        "is_default_config_bool": false,
        "source_of_data_string": "Apple Health",
        "measured_at_string": "2026-07-13T07:00:00.000-06:00"
      },
      {
        "signal_type_string": "hrv",
        "measured_value_float": null,
        "baseline_value_float": null,
        "threshold_type_string": null,
        "deviation_below_percent_float": null,
        "deviation_above_percent_float": null,
        "threshold_min_float": null,
        "threshold_max_float": null,
        "breach_direction_string": null,
        "unit_string": null,
        "is_default_config_bool": false,
        "source_of_data_string": null,
        "measured_at_string": null
      },
      {
        "signal_type_string": "resting_breathing_rate",
        "measured_value_float": null,
        "baseline_value_float": null,
        "threshold_type_string": null,
        "deviation_below_percent_float": null,
        "deviation_above_percent_float": null,
        "threshold_min_float": null,
        "threshold_max_float": null,
        "breach_direction_string": null,
        "unit_string": null,
        "is_default_config_bool": false,
        "source_of_data_string": null,
        "measured_at_string": null
      },
      {
        "signal_type_string": "oxygenation",
        "measured_value_float": null,
        "baseline_value_float": null,
        "threshold_type_string": null,
        "deviation_below_percent_float": null,
        "deviation_above_percent_float": null,
        "threshold_min_float": null,
        "threshold_max_float": null,
        "breach_direction_string": null,
        "unit_string": null,
        "is_default_config_bool": false,
        "source_of_data_string": null,
        "measured_at_string": null
      },
      {
        "signal_type_string": "sleep_duration",
        "measured_value_float": 18000.0,
        "baseline_value_float": null,
        "threshold_type_string": "fixed_range",
        "deviation_below_percent_float": null,
        "deviation_above_percent_float": null,
        "threshold_min_float": 21600.0,
        "threshold_max_float": 32400.0,
        "breach_direction_string": "below",
        "unit_string": "seconds",
        "is_default_config_bool": true,
        "source_of_data_string": "Apple Health",
        "measured_at_string": "2026-07-13T07:00:00.000-06:00"
      }
    ]
  }
}
Summary versions
A day's summary is not necessarily final the first time you receive it. Data for one night often arrives in waves — a phone syncs part of it, the watch completes it hours later — and each wave can change what was actually outside range.
When that happens ROOK re-evaluates the day and sends the summary again with a higher document_version. The newest version fully replaces the previous one for that user_id and summary_date_string.
To consume this correctly:
- Key your storage on
user_id+metadata.summary_date_string, not on arrival order. - Keep the highest
document_versionfor that key and discard lower ones. - Treat every version as a complete replacement, not a delta:
alert_signals_arrayalways describes the whole day, not what changed since the last version.
A summary with total_alerts_int: 0, where all five signals are null, is a valid and meaningful document. It means ROOK evaluated that day and found nothing outside range, and its purpose is to retract alerts that an earlier version reported and the newer data no longer supports. When you receive one, clear whatever you were showing for that day.
Silence is not the same as total_alerts_int: 0. A day ROOK could not evaluate — for example while a user's baseline is still being built — produces no summary at all. A zero-alert summary means "evaluated, nothing found".
Envelope fields
| Field | Description |
|---|---|
document_version | Version of this document for its user_id and summary_date_string. Increases when ROOK re-evaluates a day with more complete data. Keep the highest; see Summary versions. Always 1 for alert_event. |
metadata.datetime_string | For alert_summary, the end of the summarized day in the user's local time — the same value as summary_period_end_string. For alert_event, when the measurement triggered the alert. |
alerts.total_alerts_int | Number of signals that breached that day. Counts the entries whose measured_value_float is not null, so it can be 0. Only in alert_summary. |
alert_signals_array fields
In alert_summary this array always has the five signals below, in this order, whether or not they breached; the ones that did not are present with null values. In alert_event it always has exactly one element, for oxygenation.
| Field | Description |
|---|---|
signal_type_string | resting_heart_rate | hrv | resting_breathing_rate | oxygenation | sleep_duration |
measured_value_float | The measured value that triggered or was included in the alert. |
baseline_value_float | The user's baseline for that signal. null for fixed-range signals. |
threshold_type_string | baseline_deviation | fixed_range |
deviation_below_percent_float / deviation_above_percent_float | Effective deviation percent, only for baseline_deviation. null when that side doesn't apply. |
threshold_min_float / threshold_max_float | Effective threshold evaluated. null when that side doesn't apply. |
breach_direction_string | above | below |
unit_string | bpm | ms | percentage | seconds | breaths_per_min |
is_default_config_bool | true only when the ROOK default was used; false when a general or specific client rule applied. This field is never null: a signal that did not breach reports false, which carries no meaning — read it only for signals whose measured_value_float is not null. |
source_of_data_string | Data source of the measurement, for example Apple Health. |
measured_at_string | ISO 8601 timestamp of the original measurement. |
Health Monitoring delivers alert_event and alert_summary exclusively through your Data Webhook — there is no endpoint to fetch alerts directly.
If you have not configured a Data Webhook yet, see the Data Delivery section before continuing.
To activate Health Monitoring, contact the ROOK support team or your account manager.
Branded Auth On Hold
The Branded Auth add-on lets you customize the data source connection interface, removing ROOK's visual identity and replacing it with your own company's. This ensures that the end user perceives a native, consistent synchronization process within a trusted environment aligned with your brand.
By default, when users link their health devices or apps, they go through a standardized authentication flow. By activating Branded Auth, you can:
- Replace the ROOK logo with your own on all connection screens.
- Maintain visual consistency at every step of the process, from selecting the data source to confirming synchronization.
To activate Branded Auth on your instance or request details about the technical customization requirements, contact the ROOK support team or your account manager.
This process can take several weeks and partly depends on the timelines of the respective data sources. We strongly recommend starting early to avoid any delays to your launch.